
Daily Market Analysis and Forex News
NAS100 to edge higher following Nvidia's earnings?

- Nvidia exceeded Q4 2025 forecasts with $39.3B revenue
- Data center division contributed $35.6B in revenue
- Nvidia forecasts Q1 2026 revenue of $43B (+/- 2%)
- Competition from China’s DeepSeek AI remains a concern
- Nvidia makes up ~10% of NAS100, influencing the index
Largest (by market cap.) member of NAS100 index – Nvidia outperformed Wall Street forecasts in the fourth quarter of fiscal year 2025, posting revenue of $39.3 billion and earnings per share of $0.89.
These results mark a 12% rise in revenue and a 14% increase in earnings per share compared to the previous quarter.
A major driver of this growth was Nvidia's data center division, which brought in
$35.6 billion – reflecting a 16% sequential increase and an impressive 93% surge year-over-year.
Looking ahead, the company anticipates first-quarter revenue of (+/- 2%) $43 billion, signaling sustained strong demand for its AI infrastructure solutions.
While concerns emerged over competition from China's DeepSeek AI, which relies less on Nvidia's GPUs, the company has continued to demonstrate financial strength.
CEO Jensen Huang emphasized the demand for Nvidia’s Blackwell GPUs, fueled by rapid advancements in AI technology.
Nevertheless, potential disruptions from new tariff regulations could impact Nvidia’s global operations.
What about Nasdaq 100 (NAS100)?
Nvidia makes up about 10% of the NAS100's total weighting, highlighting its considerable impact.
From a technical perspective, the tech-heavy index has found support at its 100-day simple moving average (SMA).
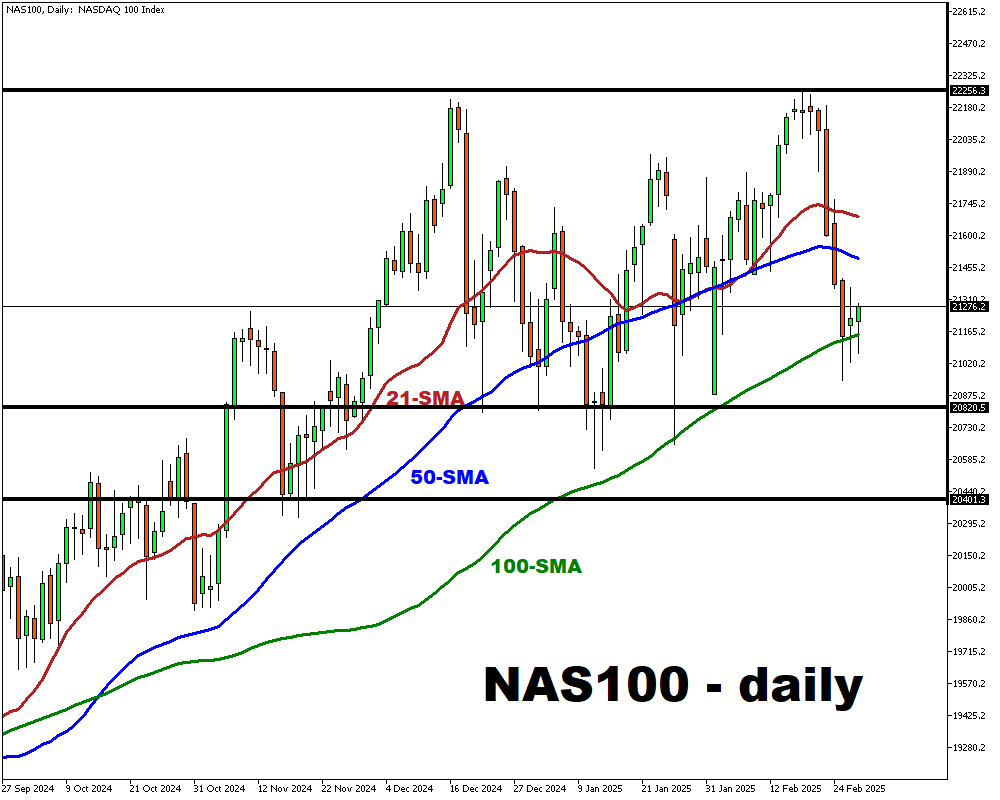
Bulls, or those anticipating a rally, may eye the following price levels as potential resistance:
- 21,492.16 – 50-period SMA
- 21,685.01 – 21-period SMA
- 22,256.30 – All-time high
Nas100 bears on the other hand may pay attention to the following potential support levels, in case of a decline:
- 21,149.86 – 100-day SMA
- 20,820.50 – neckline of a potential double top
- 20,401.30 – support line of an upward sloping trendline which began October 23, 2023
Ready to trade with real money?
Open accountGateway to global opportunity
Join more than 1 million traders worldwide using Alpari as a gateway to a better life.